
NOAA data · 2016–2025
Where in the Kansas City area is hail reported most often?
Hail reports within 5 miles of each of the 63 communities we serve, grouped into three bands, with what the comparison can and can’t tell you.
By Roof InspectorsPublished
The short answer
- Places compared
- 63
- 5-mile circles
- Higher band
- 23 places
- 9–20 hail-report days, 2016–2025
- Middle band
- 19 places
- 5–8 hail-report days, 2016–2025
- Lower band
- 21 places
- 2–4 hail-report days, 2016–2025
These are records for the wider area, not for your address. A storm on record doesn’t mean your roof was damaged, and it doesn’t mean your insurance company will accept that storm or date. That’s why an inspection is worth having: a roofing professional looks at the roof itself.
The map, by band
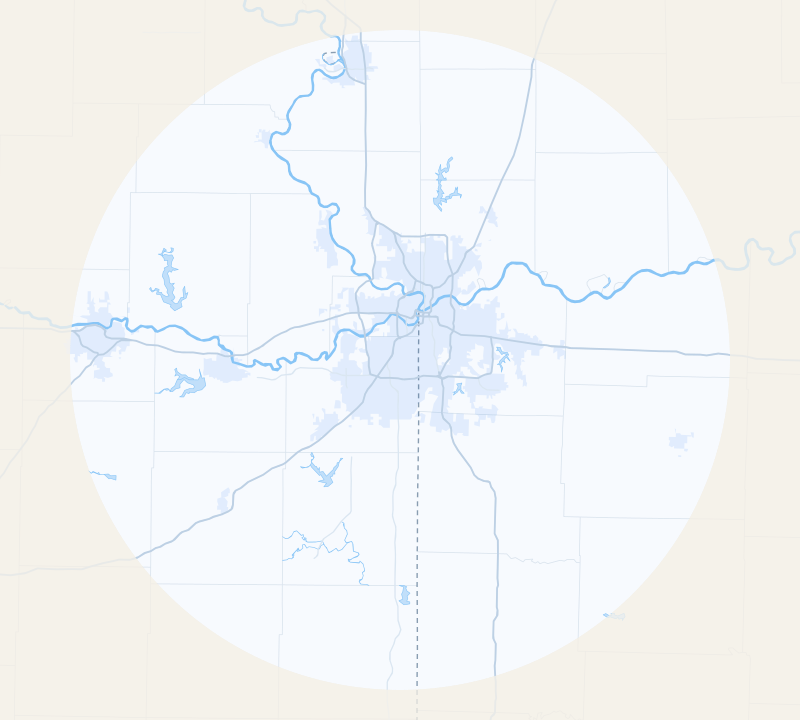
22 of the 23 higher-band places are within 25 miles of downtown Kansas City, Missouri; 17 of the 21 lower-band places are farther out. Each dot is a community we serve, shaded by its days with a hail report of 1 inch or larger within 5 miles, 2016–2025. Source: NOAA/NWS (SPC reports), data through December 31, 2025.
- Higher band: 9–20 hail-report days
- Middle band: 5–8 hail-report days
- Lower band: 2–4 hail-report days
- 60-mile service area
- Built-up area
Map data: U.S. Census Bureau TIGER/Line
Map of the 63 communities we serve, each dot shaded by its band of hail-report days within 5 miles, 2016–2025: higher band, 23 places with 9–20 hail-report days; middle band, 19 places with 5–8 hail-report days; lower band, 21 places with 2–4 hail-report days. Every place is listed by band below the map.
Every place, by band
Within each band, places are listed alphabetically. They aren’t ranked: a day or two either way is within the chance of who happened to see and report hail.
Higher band
23 places · 9–20 hail-report days
Middle band
19 places · 5–8 hail-report days
See the numbers for every place
| Place | Band | Hail-report days 2016–2025 | Radar hail days 2021–2025 |
|---|---|---|---|
| EdwardsvilleWyandotte County | Higher | 11 | 10 |
| FairwayJohnson County | Higher | 13 | 6 |
| GladstoneClay County | Higher | 13 | 8 |
| IndependenceJackson County | Higher | 13 | 3 |
| Kansas City, KSWyandotte County | Higher | 10 | 5 |
| LeawoodJohnson County | Higher | 9 | 5 |
| Lee’s SummitJackson County | Higher | 9 | 4 |
| LenexaJohnson County | Higher | 18 | 10 |
| LibertyClay County | Higher | 9 | 7 |
| MerriamJohnson County | Higher | 15 | 9 |
| MissionJohnson County | Higher | 16 | 5 |
| Mission HillsJohnson County | Higher | 12 | 6 |
| North Kansas CityClay County | Higher | 12 | 5 |
| OlatheJohnson County | Higher | 20 | 9 |
| Overland ParkJohnson County | Higher | 14 | 6 |
| ParkvillePlatte County | Higher | 13 | 5 |
| Platte CityPlatte County | Higher | 9 | 4 |
| Prairie VillageJohnson County | Higher | 12 | 6 |
| RaytownJackson County | Higher | 10 | 4 |
| RiversidePlatte County | Higher | 16 | 4 |
| Roeland ParkJohnson County | Higher | 16 | 7 |
| ShawneeJohnson County | Higher | 15 | 9 |
| TopekaShawnee County | Higher | 13 | 6 |
| AtchisonAtchison County | Middle | 5 | 1 |
| Blue SpringsJackson County | Middle | 8 | 8 |
| Bonner SpringsWyandotte County | Middle | 7 | 7 |
| CameronClinton County | Middle | 7 | 3 |
| De SotoJohnson County | Middle | 6 | 5 |
| Excelsior SpringsClay County | Middle | 7 | 7 |
| GarnettAnderson County | Middle | 6 | 1 |
| Grain ValleyJackson County | Middle | 8 | 6 |
| GreenwoodJackson County | Middle | 8 | 4 |
| Kansas City, MOJackson County | Middle | 8 | 5 |
| KearneyClay County | Middle | 7 | 3 |
| LansingLeavenworth County | Middle | 5 | 4 |
| LawrenceDouglas County | Middle | 6 | 4 |
| LeavenworthLeavenworth County | Middle | 8 | 6 |
| Oak GroveJackson County | Middle | 6 | 4 |
| OttawaFranklin County | Middle | 5 | 4 |
| SmithvilleClay County | Middle | 8 | 3 |
| Spring HillJohnson County | Middle | 5 | 4 |
| WarrensburgJohnson County, MO | Middle | 7 | 2 |
| Baldwin CityDouglas County | Lower | 4 | 3 |
| BasehorLeavenworth County | Lower | 4 | 6 |
| BeltonCass County | Lower | 4 | 3 |
| ButlerBates County | Lower | 4 | 3 |
| EudoraDouglas County | Lower | 2 | 3 |
| GardnerJohnson County | Lower | 3 | 4 |
| GrandviewJackson County | Lower | 2 | 4 |
| HarrisonvilleCass County | Lower | 3 | 3 |
| HigginsvilleLafayette County | Lower | 3 | 1 |
| LexingtonLafayette County | Lower | 2 | 2 |
| LouisburgMiami County | Lower | 3 | 3 |
| OdessaLafayette County | Lower | 4 | 2 |
| OsawatomieMiami County | Lower | 4 | 2 |
| PaolaMiami County | Lower | 2 | 1 |
| PeculiarCass County | Lower | 3 | 4 |
| PlattsburgClinton County | Lower | 2 | 3 |
| Pleasant HillCass County | Lower | 3 | 7 |
| RaymoreCass County | Lower | 3 | 3 |
| RichmondRay County | Lower | 3 | 3 |
| St. JosephBuchanan County | Lower | 2 | 1 |
| TonganoxieLeavenworth County | Lower | 3 | 6 |
What this comparison can and can’t tell you
It shows where hail of 1 inch or larger was reported most often. It doesn’t measure how much hail fell on any street or roof.
- Circles in the inner suburbs overlap, so neighboring places share many of the same reports.
- A 5-mile circle covers only part of a large city: for Kansas City, Missouri, it is the area around downtown.
- Report counts follow where people and storm spotters are. A busy area with more people watching logs more reports than open country under the same storm.
- Counts this small vary by chance: a place a day or two from a band edge could land in the next band over another ten years.
- Radar hail days count only when a Weather Service hail report also fell nearby, so they share the same bias.
- Radar hail days can be higher than report days even though they cover fewer years (2021–2025). They count radar-estimated hail of 1 inch or larger over the circle whenever the Weather Service logged a hail report of any size within 20 miles of the place’s center that day, so a place in the lower band can still show several radar days (Pleasant Hill: 7). A lower band doesn’t mean hail is rare where you live.
- Some city pages use a bigger circle for their own storm record (10 miles for Kansas City, Missouri; 6 for Topeka, Lawrence and St. Joseph). This comparison uses 5 miles for every place, so the numbers differ.
How we counted
A hail-report day is a storm day (NOAA’s noon-to-noon UTC day) with at least one National Weather Service hail report of 1 inch or larger within 5 miles of a place’s downtown or city hall; several reports on the same day count once. We ordered the 63 places by days with a hail report of 1 inch or larger within 5 miles in 2016–2025, split the list into thirds, and kept places tied at a split in the higher band; a place with none is always in the lower band.
The full method and sources
We used the ten complete years 2016–2025, which NOAA has finalized; 2026 is left out until its final data is published. For 2026 so far, see the 2026 Kansas City hail report. The bands use hail reports only, and this time they hold 23, 19, 21 places, so they aren’t equal thirds. These numbers were frozen on November 3, 2026; when we move to newer years, we’ll date the change here.
Radar hail days (2021–2025, the full years of NOAA MRMS radar data we hold) are days when radar estimated hail of 1 inch or larger over the circle and the Weather Service also logged a hail report of any size within 20 miles of the place’s center that day; readings above about 6 inches are dropped. They’re in the table and the CSV for context.
Reports come from trained spotters, emergency managers, the public and weather stations, so they show where people saw hail, not every place it fell.
Our storm records come from NOAA radar estimates and National Weather Service reports. Radar can miss or misjudge hail, and a report marks a single spot, so records can be incomplete. Treat them as a starting point, not a verdict about your roof.
For reporters and researchers
Every place’s numbers and band: kc-hail-days-by-place.csv. Share images: wide and square. Metro-wide numbers by year and month are on Kansas City hail history. Please credit Roof Inspectors and link to this page.
File details and license
One row per place, in the page’s order: place, state, county, lat, lng, radius_mi, report_days_2016_2025, radar_days_2021_2025, band and data_through. lat and lng are the point each 5-mile circle is drawn around, and data_through is the last storm day counted.
You can reuse this file under CC BY 4.0 with credit to Roof Inspectors. The underlying NOAA data is U.S. government work in the public domain.
Was hail recorded near your house?
See how many significant storms are on record near your address, free in about 30 seconds. Add your contact details to see each storm’s date and hail size.
- Doesn’t file an insurance claim
- One local partner, never a pile-on
If you file a claim, even after an inspection, your insurance company decides what’s covered and what it pays. Roof Inspectors and our roofing partners can’t make that decision or promise an outcome.